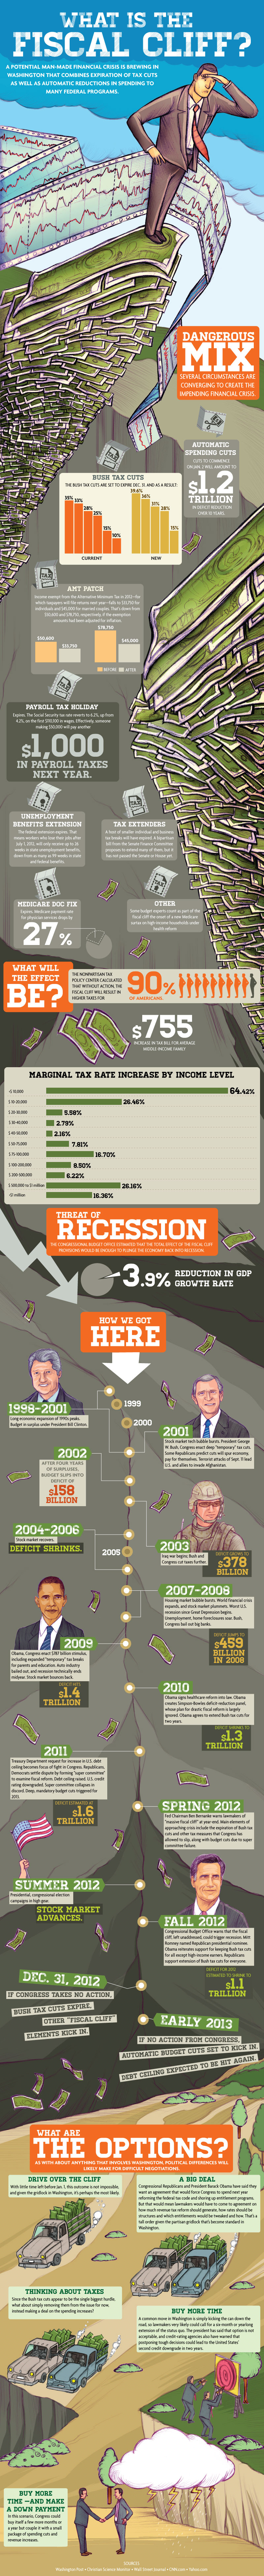
Without action, the Fiscal Cliff will result in higher taxes for 90% of Americans and $775 higher tax bill for middle income Americans. Turn on your TV and you will hear democrats and republicans blaming each other and this makes it hard for average folks to know how did we get here, why is this happening, what are our options and how will this affect me?
We invite you to use this great infographic from DirectLendingSolutions.com. Those who read this infographic will be sure to impress at the next dinner party with their knowledge of the fiscal cliff.
- What is Causing this Perfect Storm of Financial Doom? Stimulus programs are set to expire at the same time we are reducing fiscal support of various programs
- Expiration of Bush Tax Cuts, would take wealthiest from 35% to 39.6%
- When Payroll Tax expires we each will pay $1,000 more
- Unemployment benefits extension expires. Benefits will return to 26 weeks down from as many as 99 weeks
- Automatic spending cuts of $1.2 trillion
- How did we get here? Takes readers through from the budget surplus/economic expansion of the 1990’s, tech bubble, 9/11 and the wars, housing bubble, stimulus and more. See each President’s role. ..
- What are the options? Explains what happens if we “Drive Over the Cliff”, get the “Big Deal”, and “Kick the Can Down the Road”