We have seen a bug run up in stocks this month and things are looking a little long in the teeth. A large number of stocks are trading above their upper Bollinger band and the broad market is testing that key resistance level also. Typically when a Bollinger band is reached we see price reverse for a couple days at minimum.
While the equities market is in a new uptrend as seen by the moving averages…… pullback seems imminent. The last two days has formed reversal candles and are pointing to lower prices…Trade cautiously in all asset classes.
-Umesh Shanmugam(Purely my view)

Dollar Index Chart:
This chart shows a possible bottom forming in the dollar pointing to a 3-8 day pullback in stocks.

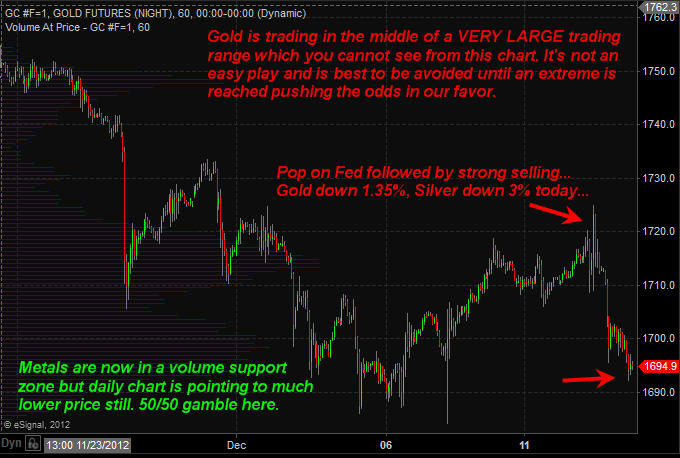
Gold Chart: