The Eight core industries have a combined weight of 37.90 per cent in the Index of Industrial Production (IIP). The combined Index was 144.4 in February 2013 with a growth rate of (-) 2.5% compared to their 7.7% growth in February 2012. The decline in growth in February,2013 was on account of negative growth witnessed in Electricity generation and in the production of Crude Oil, Coal, Natural Gas and Fertilizers.
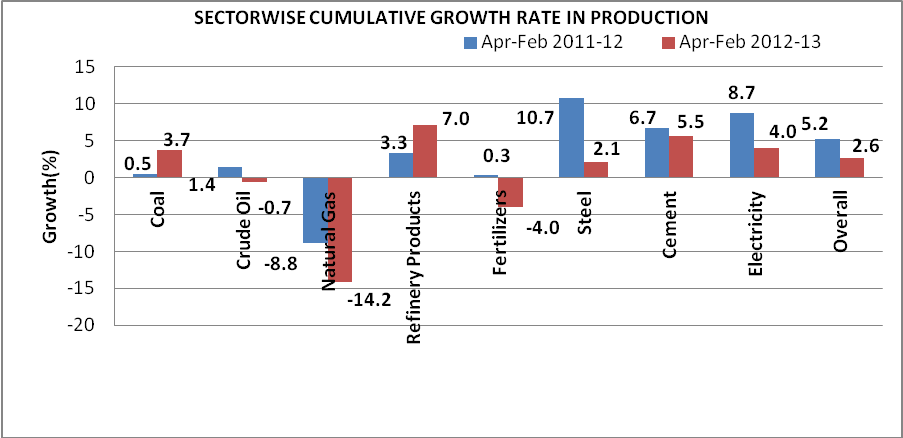
During April-February 2012-13, the cumulative growth rate of the Core industries was 2.6 % compared to their growth at 5.2% during the corresponding period in 2011-12.
Coal
Coal production (weight: 4.38%) registered a growth of (-) 8.0% in February 2013 compared to its growth at 18.0% inFebruary 2012. In cumulative terms, Coal production recorded a growth of 3.7% during April-February 2012-13 compared to its growth at 0.5% during the same period of 2011-12.
Crude Oil
Crude Oil production (weight: 5.22%) registered a growth of (-) 4.0% in February 2013 compared to its 0.3% growth inFebruary 2012. Cumulatively, Crude Oil production recorded a growth of (-) 0.7% during April-February 2012-13 compared to its growth at 1.4% during the same period of 2011-12.
Natural Gas
The growth rate of Natural Gas production (weight: 1.71%) was negative both in February, 2013 at (-) 20.1% and inFebruary 2012 at (-) 7.6%. Cumulatively also, Natural Gas production registered a negative growth of (-) 14.2% during April-February 2012-13 and (-) 8.8% during the same period of 2011-12.
Petroleum Refinery Products (0.93% of Crude Throughput)*
Petroleum refinery production (weight: 5.94%) had a growth of 4.3% in February 2013 compared to its growth at 6.0% in February 2012. In cumulative terms, Petroleum refinery production registered a growth of 7.0% during April-February 2012-13 compared to its 3.3% growth during the same period of 2011-12.
Fertilizers
Fertilizer production (weight: 1.25%) registered a growth of (-) 4.0% in February 2013 against its growth at 4.1% inFebruary 2012. Cumulatively, Fertilizer production registered a growth of (-) 4.0% during April-February2012-13 compared to its 0.3% growth during the same period of 2011-12.
Steel (Alloy + Non-Alloy)
Steel production (weight: 6.68%) had a growth rate of 0.5% in February 2013 against its 8.7% growth inFebruary 2012. Cumulatively, Steel production registered 2.1% growth during April-February 2012-13 compared to its 10.7% growth during the same period of 2011-12.
Cement
Cement production (weight: 2.41%) registered a growth of 3.9% in February 2013 against its 9.8% growth inFebruary 2012. The cumulative growth of Cement Production was 5.5% during April-February 2012-13 compared to its 6.7% growth during the same period of 2011-12.
Electricity
Electricity generation (weight: 10.32%) had a (-) 4.1% growth in February 2013 compared to its 8.6% growth in February 2012. The cumulative growth of Electricity generation was 4.0% during April-February 2012-13 compared to its 8.7% growth during the same period of 2011-12.
* RPL (SEZ) with refining capacity 29MMT was commissioned on 25.12.2008 but crude throughput not reported by the refinery and not included in production for entire period.
N.B: Data are provisional. Revision has been made based on revised data obtained.
|
Annexure
PERFORMANCE OF EIGHT CORE INDUSTRIES YEARLY INDEX & GROWTH RATEBASE YEAR 2004-05=100 (Weight in IIP: 37.90 %) |
|
|
INDEX
| Sector | Weight | 2007-08 | 2008-09 | 2009-10 | 2010-11 | 2011-12 | Apr-Feb
2011-12 |
Apr-Feb 2012-13 |
| Coal |
4.379 |
119.9 |
129.5 |
140.0 |
139.7 |
141.4 |
135.9 |
140.9 |
| Crude Oil |
5.216 |
100.4 |
98.6 |
99.1 |
111.0 |
112.1 |
111.9 |
111.2 |
| Natural Gas |
1.708 |
102.1 |
103.4 |
149.5 |
164.4 |
149.7 |
150.1 |
128.8 |
| Refinery Products |
5.939 |
122.8 |
126.5 |
125.9 |
129.7 |
133.7 |
132.8 |
142.2 |
| Fertilizers |
1.254 |
95.5 |
91.8 |
103.4 |
103.4 |
103.8 |
104.6 |
100.4 |
| Steel |
6.684 |
128.9 |
131.4 |
139.3 |
157.7 |
174.0 |
173.2 |
176.9 |
| Cement |
2.406 |
132.5 |
142.1 |
157.1 |
164.2 |
175.2 |
172.1 |
181.7 |
| Electricity |
10.316 |
119.9 |
123.2 |
130.8 |
138.1 |
149.3 |
148.4 |
154.4 |
| Overall Index |
37.903 |
118.5 |
121.8 |
129.9 |
138.4 |
145.3 |
144.0 |
147.7 |
GROWTH RATE (in %)
| Sector | Weight | 2007-08 | 2008-09 | 2009-10 | 2010-11 | 2011-12 | Apr-Feb 2011-12 | Apr-Feb
2012-13 |
| Coal |
4.379 |
6.3 |
8.0 |
8.1 |
-0.2 |
1.2 |
0.5 |
3.7 |
| Crude Oil |
5.216 |
0.4 |
-1.8 |
0.5 |
11.9 |
1.0 |
1.4 |
-0.7 |
| Natural Gas |
1.708 |
2.1 |
1.3 |
44.6 |
10.0 |
-8.9 |
-8.8 |
-14.2 |
| Refinery Products |
5.939 |
6.5 |
3.0 |
-0.4 |
3.0 |
3.1 |
3.3 |
7.0 |
| Fertilizers |
1.254 |
-7.9 |
-3.9 |
12.7 |
0.0 |
0.4 |
0.3 |
-4.0 |
| Steel |
6.684 |
6.8 |
1.9 |
6.0 |
13.2 |
10.3 |
10.7 |
2.1 |
| Cement |
2.406 |
8.1 |
7.2 |
10.5 |
4.5 |
6.7 |
6.7 |
5.5 |
| Electricity |
10.316 |
6.3 |
2.7 |
6.2 |
5.6 |
8.1 |
8.7 |
4.0 |
| Overall Index |
37.903 |
5.2 |
2.8 |
6.6 |
6.6 |
5.0 |
5.2 |
2.6 |
PERFORMANCE OF EIGHT CORE INDUSTRIES
MONTHLY INDEX & GROWTH RATE
BASE YEAR 2004-05=100
(Weight in IIP: 37.90 %)
INDEX
| Sector | Coal | Crude Oil | Natural Gas | Refinery Products | Fertilizers | Steel | Cement | Electricity | Overall Index |
| Weight |
4.38 |
5.22 |
1.71 |
5.94 |
1.25 |
6.68 |
2.41 |
10.32 |
37.90 |
|
Feb-12 |
175.7 |
105.8 |
136.4 |
133.7 |
102.7 |
175.5 |
189.8 |
145.8 |
148.0 |
|
Mar-12 |
202.7 |
113.6 |
145.4 |
143.8 |
94.7 |
182.2 |
208.8 |
158.6 |
159.8 |
|
Apr-12 |
131.7 |
111.0 |
137.2 |
132.9 |
80.6 |
169.9 |
187.3 |
153.7 |
143.9 |
|
May-12 |
140.3 |
114.7 |
139.7 |
139.7 |
87.2 |
178.6 |
187.5 |
162.3 |
150.6 |
|
Jun-12 |
131.5 |
110.9 |
133.5 |
141.4 |
90.4 |
175.0 |
181.0 |
156.9 |
146.7 |
|
Jul-12 |
125.9 |
115.0 |
135.3 |
141.4 |
106.6 |
175.5 |
177.2 |
156.2 |
146.9 |
|
Aug-12 |
114.4 |
114.0 |
134.0 |
143.5 |
108.6 |
177.5 |
161.8 |
152.2 |
144.0 |
|
Sep-12 |
114.2 |
108.2 |
127.0 |
132.1 |
108.7 |
171.5 |
171.1 |
149.7 |
139.9 |
|
Oct-12 |
140.2 |
113.1 |
129.5 |
149.7 |
108.6 |
175.4 |
186.2 |
160.4 |
151.1 |
|
Nov-12 |
144.8 |
109.7 |
123.3 |
145.2 |
106.9 |
175.6 |
160.4 |
149.1 |
145.4 |
|
Dec-12 |
167.7 |
113.2 |
125.9 |
146.7 |
105.8 |
184.6 |
190.8 |
157.5 |
154.7 |
|
Jan-13 |
177.0 |
111.8 |
122.5 |
151.5 |
102.9 |
186.4 |
198.1 |
160.6 |
157.6 |
|
Feb-13 |
161.7 |
101.6 |
109.0 |
139.4 |
98.6 |
176.3 |
197.3 |
139.9 |
144.4 |
GROWTH RATE (in %)
| Sector | Coal | Crude Oil | Natural Gas | Refinery Products | Fertilizers | Steel | Cement | Electricity | Overall Index |
| Weight |
4.38 |
5.22 |
1.71 |
5.94 |
1.25 |
6.68 |
2.41 |
10.32 |
37.90 |
|
Feb-12 |
18.0 |
0.3 |
-7.6 |
6.0 |
4.1 |
8.7 |
9.8 |
8.6 |
7.7 |
|
Mar-12 |
6.8 |
-2.9 |
-10.1 |
1.6 |
1.5 |
6.2 |
7.1 |
2.8 |
3.0 |
|
Apr-12 |
3.8 |
-1.4 |
-11.3 |
0.6 |
-9.3 |
2.3 |
8.7 |
5.4 |
2.2 |
|
May-12 |
8.0 |
0.5 |
-10.8 |
2.9 |
-15.1 |
3.8 |
11.4 |
5.9 |
3.8 |
|
Jun-12 |
7.2 |
-0.8 |
-11.1 |
6.1 |
-11.7 |
4.1 |
10.1 |
8.8 |
4.8 |
|
Jul-12 |
2.1 |
-0.7 |
-13.5 |
3.6 |
-2.2 |
1.1 |
3.2 |
2.7 |
1.2 |
|
Aug-12 |
11.0 |
-0.6 |
-13.5 |
8.4 |
-2.1 |
2.9 |
0.4 |
1.9 |
2.6 |
|
Sep-12 |
21.4 |
-1.7 |
-14.8 |
10.3 |
5.7 |
1.3 |
13.8 |
3.9 |
4.8 |
|
Oct-12 |
10.9 |
-0.4 |
-14.9 |
20.3 |
2.0 |
-4.7 |
6.8 |
5.6 |
4.2 |
|
Nov-12 |
-4.4 |
0.8 |
-15.2 |
6.6 |
5.0 |
7.8 |
-3.0 |
2.4 |
2.0 |
|
Dec-12 |
-0.2 |
1.0 |
-14.9 |
5.0 |
-3.8 |
3.6 |
3.9 |
5.2 |
2.5 |
|
Jan-13 |
2.3 |
-0.2 |
-16.8 |
10.5 |
-9.1 |
1.9 |
3.0 |
6.3 |
3.1 |
|
Feb-13 |
-8.0 |
-4.0 |
-20.1 |
4.3 |
-4.0 |
0.5 |
3.9 |
-4.1 |
-2.5 |