 Details of exports of iron ore, coal, rare earth minerals, fruits and vegetables are given in Annexure.
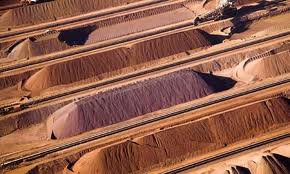
Iron ore surplus to domestic industry is being exported. Exports of iron ore have been predominantly constituted of iron ore fines. The domestic steel industry primarily consumes iron ore lumps as domestic consumption of fines is limited due to inadequate pelletization/ sintering capacity. Due to levy of export duty @ 30% ad valorem on both iron ore lumps and fines with effect from 30th December, 2011 and higher railway freight on export cargo for movement of iron ore, the exports of iron ore have declined. There is no export incentive scheme or export promotion scheme for export of coal and rare earth minerals.
The Government is taking steps to encourage exports of agro products including fruits and vegetable through measures and incentives under Plan schemes of the Commodity Boards and Export Promotion Councils. Agricultural and Processed Food Products Export Development Authority (APEDA) under the administrative control of the Department of Commerce is also implementing various schemes to extend financial assistance to the eligible exporters registered with it to boost the overall agriexports. Besides these measures, the Ministry of Commerce & Industry has put in place various schemes namely Market Development Assistance (MDA), Market Assistance Initiative (MAI), Assistance to States for Developing Export Infrastructure and Allied Activities (ASIDE), Vishesh Krishi and Gram Upaj Yojana, Focus Product Scheme, Focust Market Scheme, Town of Export Excellence, etc. to provide assistance to encourage exports. Trade delegations are also mounted to penetrate foreign markets and Buyer-Seller Meets are organized to assist the potential exports.
Annexure
Export of iron ore, coal, rare earth minerals and fruits & vegetables
| Iron Ore (Quantity in lakh tonnes. Value in Rs. crores) | ||||||||||
| Country | 2009-10 | 2010-11 | 2011-12 (P) | 2012-13 (April to September) (P) | ||||||
| Quantity | Value (estimate) | Quantity | Value | Quantity | Value | Quantity | Value | |||
| China |
1093.00 |
38383.59 |
897.30 |
38001.11 |
577.30 |
31764.63 |
132.40 |
NA |
||
| Japan |
58.70 |
2432.39 |
54.50 |
2371.50 |
24.50 |
1219.49 |
9.80 |
NA |
||
| S.Korea |
13.20 |
574.95 |
14.60 |
582.12 |
10.20 |
639.74 |
0.00 |
NA |
||
| Europe |
7.20 |
329.86 |
6.70 |
211.11 |
3.80 |
233.29 |
1.90 |
NA |
||
| Others |
1.70 |
74.06 |
3.50 |
130.02 |
1.60 |
54.60 |
0.30 |
NA |
||
| Total |
1173.70 |
41794.85 |
976.60 |
41295.86 |
617.40 |
33911.75 |
144.40 |
NA |
||
| Coal (Quantity in ‘000 tonnes. Value in Rs. crores) | ||||||||||
| 2009-10 | 2010-11 | 2011-12 | 2012-13 | |||||||
| Quantity | Value | Quantity | Value | Quantity | Value | Quantity | Value | |||
| Bangladesh |
NA |
333.86 |
NA |
246.24 |
NA |
309.15 |
NA |
NA |
||
| Nepal |
NA |
72.48 |
NA |
120.17 |
NA |
234.89 |
NA |
NA |
||
| China |
NA |
0.0 |
NA |
702.43 |
NA |
0.14 |
NA |
NA |
||
| Bhutan |
NA |
19.00 |
NA |
2.00 |
NA |
32.88 |
NA |
NA |
||
| Indonesia |
NA |
6.12 |
NA |
0.07 |
NA |
0.77 |
NA |
NA |
||
| Egypt |
NA |
0.0 |
NA |
0.34 |
NA |
0.20 |
NA |
NA |
||
| Iran |
NA |
0.68 |
NA |
0.12 |
NA |
0.0 |
NA |
NA |
||
| U.S.A |
NA |
2.03 |
NA |
0.0 |
NA |
0.44 |
NA |
NA |
||
| Mauritius |
NA |
0.50 |
NA |
0.0 |
NA |
0.02 |
NA |
NA |
||
| Saudi Arabia |
NA |
0.08 |
NA |
0.10 |
NA |
0.63 |
NA |
NA |
||
| U.A.E |
NA |
0.56 |
NA |
0.27 |
NA |
0.43 |
NA |
NA |
||
| Others |
NA |
64.11 |
NA |
81.3 |
NA |
8.33 |
NA |
NA |
||
| Total |
NA |
499.42 |
NA |
1152.77 |
NA |
587.88 |
NA |
NA |
||
|
Rare Earth Minerals – Monazite MK Grade (Quantity in MT. Value in Rs. Lakhs) |
||||||||||
| 2009-10 | 2010-11 | 2011-12 | 2012-13 | |||||||
| Quantity | Value | Quantity | Value | Quantity | Value | Quantity | Value | |||
| Japan |
5 |
9.97 |
5 |
9.97 |
4 |
13.15 |
Nil |
Nil |
||
|
Fruits (Quantity in ‘000 tonnes. Value in Rs. crores) |
||||||||||
| 2009-10 | 2010-11 | 2011-12 | 2012-13 (April to July) | |||||||
| Quantity | Value | Quantity | Value | Quantity | Value | Quantity | Value | |||
| Bangladesh |
145.95 |
166.62 |
136.99 |
171.88 |
149.70 |
414.83 |
23.93 |
54.10 |
||
| U.A.E |
119.85 |
360.19 |
103.40 |
310.77 |
106.44 |
345.43 |
69.61 |
277.72 |
||
| Netherland |
38.93 |
229.01 |
23.78 |
171.17 |
22.36 |
190.81 |
13.45 |
100.56 |
||
| U.K. |
20.98 |
134.52 |
12.72 |
94.45 |
13.09 |
110.69 |
10.91 |
110.75 |
||
| Saudi Arabia |
30.11 |
94.39 |
24.74 |
74.40 |
27.28 |
105.49 |
13.79 |
66.22 |
||
| Nepal |
38.96 |
36.33 |
30.08 |
29.59 |
42.98 |
63.10 |
18.36 |
23.26 |
||
| Russia |
1.36 |
12.03 |
2.47 |
25.90 |
5.49 |
47.03 |
3.35 |
29.37 |
||
| Germany |
3.73 |
27.98 |
2.04 |
25.96 |
2.59 |
36.28 |
1.15 |
10.51 |
||
| Egypt |
2.82 |
42.18 |
2.30 |
31.19 |
2.00 |
35.65 |
2.67 |
29.81 |
||
| Spain |
1.33 |
26.78 |
0.95 |
18.63 |
0.96 |
34.20 |
0.66 |
8.48 |
||
| Malaysia |
1.67 |
9.02 |
2.29 |
12.51 |
6.10 |
31.07 |
1.26 |
9.34 |
||
| Kuwait |
11.20 |
38.74 |
9.52 |
24.69 |
7.48 |
28.50 |
3.51 |
14.80 |
||
| Sweden |
0.40 |
4.39 |
0.93 |
9.80 |
2.38 |
22.37 |
0.74 |
9.82 |
||
| Thailand |
1.26 |
12.07 |
1.46 |
16.53 |
2.28 |
22.04 |
0.41 |
4.51 |
||
| U.S.A |
1.79 |
10.42 |
2.13 |
14.30 |
2.00 |
18.67 |
1.06 |
15.94 |
||
| Sri Lanka |
2.00 |
5.87 |
2.36 |
6.09 |
3.18 |
17.28 |
1.06 |
5.97 |
||
| France |
1.47 |
15.21 |
1.03 |
20.57 |
0.71 |
16.60 |
0.36 |
2.26 |
||
| Oman |
5.03 |
16.75 |
4.23 |
13.86 |
4.67 |
15.63 |
1.99 |
7.63 |
||
| Bahrain |
9.28 |
23.50 |
16.09 |
15.03 |
6.81 |
15.51 |
3.61 |
9.75 |
||
| Pakistan |
0.88 |
0.23 |
2.77 |
8.75 |
3.73 |
12.71 |
8.47 |
19.58 |
||
| Others |
36.36 |
200.38 |
35.25 |
159.34 |
36.97 |
195.64 |
18.96 |
108.52 |
||
| Total |
475.36 |
1466.61 |
417.53 |
1255.41 |
449.20 |
1779.53 |
199.31 |
918.90 |
||
|
Onion (Quantity in ‘000 tonnes, Value in Rs. crores) |
||||||||||
|
2009-10 |
2010-11 |
2011-12 |
2012-13(April to July) |
|||||||
|
Quantity |
Value |
Quantity |
Value |
Quantity |
Value |
Quantity |
Value |
|||
| Malaysia |
303.14 |
413.29 |
281.36 |
491.87 |
301.31 |
443.45 |
135.48 |
158.17 |
||
| Bangladesh |
764.10 |
1126.20 |
391.55 |
572.33 |
313.63 |
386.21 |
132.65 |
94.97 |
||
| UAE |
147.16 |
179.04 |
127.26 |
165.74 |
179.05 |
221.89 |
83.02 |
62.50 |
||
| Sri Lanka |
129.33 |
193.04 |
120.38 |
178.42 |
153.27 |
174.64 |
72.18 |
63.94 |
||
| Pakistan |
102.00 |
107.71 |
45.69 |
54.18 |
75.62 |
104.60 |
0.00 |
0.00 |
||
| Others |
219.19 |
300.15 |
216.08 |
316.74 |
286.98 |
392.06 |
166.44 |
165.92 |
||
| Total |
1664.92 |
2319.43 |
1182.32 |
1779.28 |
1309.86 |
1722.85 |
589.77 |
545.50 |
||
|
Other Fresh Vegetables (Quantity in ‘000 tonnes, Value in Rs. crores) |
||||||||||
|
2009-10 |
2010-11 |
2011-12 |
2012-13(April to July) |
|||||||
|
Quantity |
Value |
Quantity |
Value |
Quantity |
Value |
Quantity |
Value |
|||
| Pakistan |
81.04 |
87.63 |
6.47 |
10.57 |
219.81 |
398.87 |
6.24 |
13.40 |
||
| U.A.E. |
81.55 |
165.75 |
101.79 |
239.23 |
100.20 |
207.68 |
26.40 |
70.13 |
||
| U.K. |
19.79 |
80.98 |
17.05 |
70.09 |
22.09 |
114.90 |
7.35 |
47.95 |
||
| Nepal |
95.92 |
62.04 |
138.02 |
77.49 |
170.74 |
96.31 |
40.02 |
31.53 |
||
|
Saudi Arabia |
17.23 |
56.20 |
20.56 |
65.85 |
23.14 |
84.54 |
7.34 |
26.55 |
||
| Others |
123.71 |
279.26 |
210.86 |
446.53 |
193.73 |
396.58 |
55.47 |
146.01 |
||
| Total |
419.24 |
731.86 |
494.75 |
909.76 |
729.71 |
1298.88 |
142.82 |
335.57 |
||
(P) = provisional NA = Not available.
This information was given by the Minister of State for Commerce & Industry Dr. D. Purandeswari in written reply to a question in Lok Sabha today.