21 May 2021 Brussels, Belgium
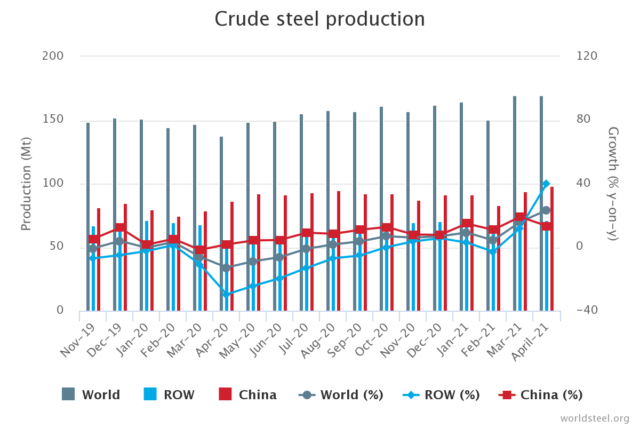
World crude steel production for the 64 countries reporting to the World Steel Association (worldsteel) was 169.5 million tonnes (Mt) in April 2021, a 23.3% increase compared to April 2020.
Crude steel production by region
Africa produced 1.3 Mt in April 2021, up 93.9% on April 2020. Asia and Oceania produced 125.0 Mt, up 19.2%. The CIS produced 9.0 Mt, up 20.7%. The EU (27) produced 12.9 Mt, up 42.8%. Europe, Other produced 4.2 Mt, up 33.9% The Middle East produced 3.5 Mt, up 15.3%. North America produced 9.7 Mt, up 38.2%. South America produced 3.8 Mt, up 70.9%.
| Table 1. Crude steel production by region | |||||
| Apr 2021 (Mt) | % change Apr 21/20 | Jan-Apr 2021 (Mt) | % change Jan-Apr 21/20 | ||
| Africa | 1.3 | 93.9 | 5.2 | 17.0 | |
| Asia and Oceania | 125.0 | 19.2 | 487.8 | 15.3 | |
| CIS | 9.0 | 20.7 | 35.3 | 7.4 | |
| EU (27) | 12.9 | 42.8 | 51.0 | 11.6 | |
| Europe, Other | 4.2 | 33.9 | 16.7 | 13.1 | |
| Middle East | 3.5 | 15.3 | 14.1 | 6.0 | |
| North America | 9.7 | 38.2 | 38.0 | 3.8 | |
| South America | 3.8 | 70.9 | 14.7 | 18.2 | |
| Total 64 countries | 169.5 | 23.3 | 662.8 | 13.7 |
The 64 countries included in this table accounted for approximately 98% of total world crude steel production in 2020. Regions and countries covered by the table:
- Africa: Egypt, Libya, South Africa
- Asia and Oceania: Australia, China, India, Japan, New Zealand, Pakistan, South Korea, Taiwan (China), Vietnam
- CIS: Belarus, Kazakhstan, Moldova, Russia, Ukraine, Uzbekistan
- European Union (27)
- Europe, Other: Bosnia-Herzegovina, Macedonia, Norway, Serbia, Turkey, United Kingdom
- Middle East: Iran, Qatar, Saudi Arabia, United Arab Emirates
- North America: Canada, Cuba, El Salvador, Guatemala, Mexico, United States
- South America: Argentina, Brazil, Chile, Colombia, Ecuador, Paraguay, Peru, Uruguay, Venezuela
Top 10 steel-producing countries
China produced 97.9 Mt in April 2021, up 13.4% on April 2020. India produced 8.3 Mt, up 152.1%. Japan produced 7.8 Mt, up 18.9%. The United States produced 6.9 Mt, up 43.0%. Russia is estimated to have produced 6.5 Mt, up 15.1%. South Korea is estimated to have produced 5.9 Mt, up 15.4%. Germany produced 3.4 Mt, up 31.5%. Turkey produced 3.3 Mt, up 46.6%. Brazil produced 3.1 Mt, up 59.3%. Iran is estimated to have produced 2.5 Mt, up 6.4%.
| Table 2. Top 10 steel-producing countries | ||||||
| Apr 2021 (Mt) | % change Apr 21/20 | Jan-Apr 2021 (Mt) | % change Jan-Apr 21/20 | |||
| China | 97.9 | 13.4 | 374.6 | 15.8 | ||
| India | 8.3 | 152.1 | 38.2 | 26.9 | ||
| Japan | 7.8 | 18.9 | 31.5 | 2.7 | ||
| United States | 6.9 | 43.0 | 27.3 | 2.8 | ||
| Russia | 6.5 | e | 15.1 | 25.5 | 7.1 | |
| South Korea | 5.9 | e | 15.4 | 23.4 | 6.5 | |
| Germany | 3.4 | 31.5 | 13.5 | 9.0 | ||
| Turkey | 3.3 | 46.6 | 13.1 | 16.9 | ||
| Brazil | 3.1 | 59.3 | 11.8 | 15.9 | ||
| Iran | 2.5 | e | 6.4 | 10.0 | 9.6 |
e – estimated. Ranking of top 10 producing countries is based on year-to-date aggregate
Note:
- The World Steel Association (worldsteel) is one of the largest and most dynamic industry associations in the world, with members in every major steel-producing country. worldsteel represents steel producers, national and regional steel industry associations, and steel research institutes. Members represent around 85% of global steel production.
- As of January 2021, worldsteel no longer makes all of its monthly production data available to the public free of charge. Crude steel production by region and the production of the top ten steel-producing countries continue to be available. A subscription with access to the iron and crude steel production data for all other countries is available for €975 via the worldsteel bookshop. This subscription includes access to 20 years of data in the Steel Statistical Yearbooks. Please contact subscribers@worldsteel.org with any questions.
- Information on capacity can be found on the OECD website.